Your monthly report, without the spreadsheet marathon.
Dashboards and automated reporting for independent clinics and growing service businesses in the UK. One reliable view of revenue, visits, no-shows and targets, which updates itself.
Sound familiar?
In many growing clinics and service firms, reporting still means exports, spreadsheets and a lot of checking.
Someone exports from three systems, pastes into a spreadsheet and rebuilds the same pack by hand.
"Revenue" means something different in each report, so meetings start with arguing about the data.
By the time the pack arrives, the month is over and the no-shows, gaps and missed targets are history.
Three ways to start
Small, fixed-price, clearly scoped. Every project includes written KPI definitions, validation against your source data and a handover.
Reporting Rescue
Fix one painful report.
- Clean up to 3 spreadsheets or exports
- Automate one repetitive step
- A simple KPI report and handover note
BI Dashboard
One use case, one data source, done properly.
- Interactive Power BI dashboard
- Agreed KPIs and data validation
- Refresh set-up and a walkthrough
Monthly Analytics Partner
Keep it accurate and useful.
- Maintenance and data-quality checks
- A monthly insights summary
- Small changes and a review call
Several systems joined into one scored view: Connected Clinic, £2,650 (6-8 weeks). Prices in pounds. Licences and third-party subscriptions are separate.
See it before we talk
Interactive demos built on synthetic data for fictional companies. No real client or patient data is used.
Clinic performance
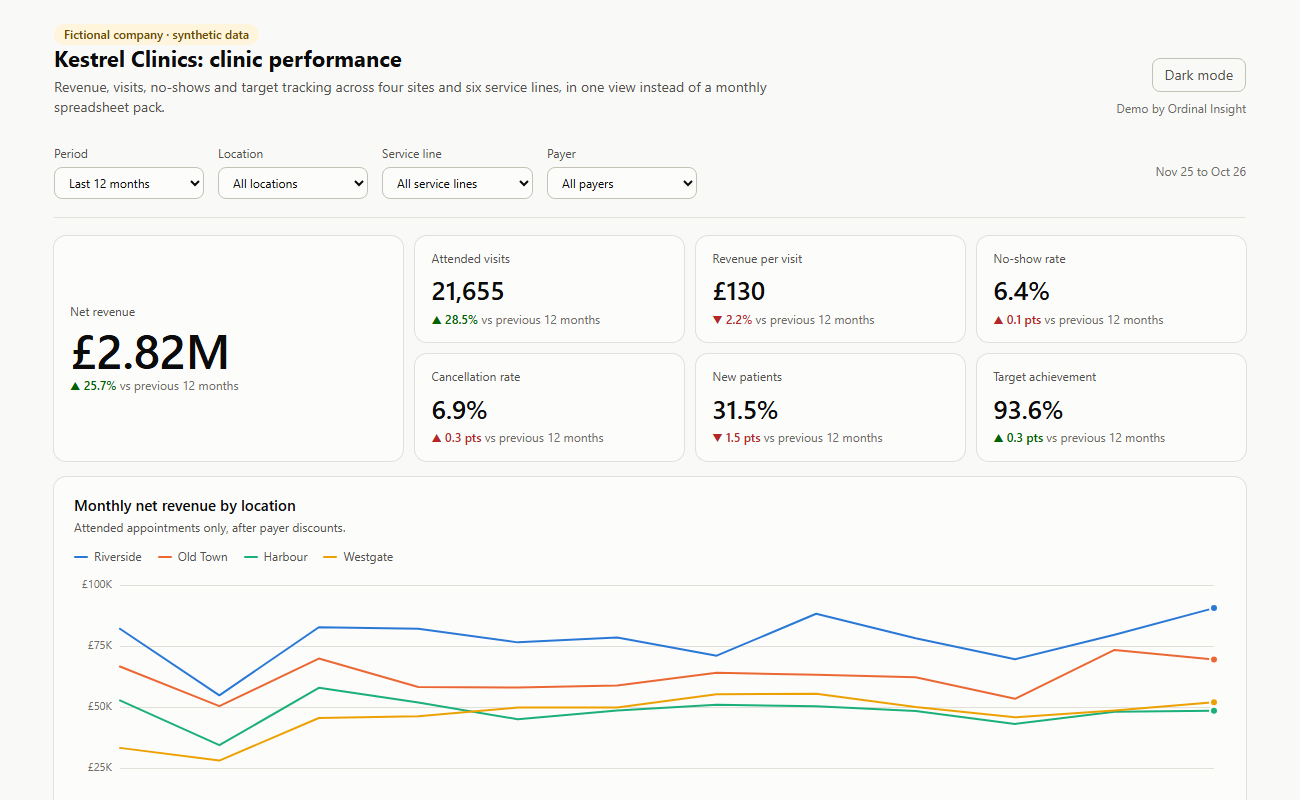
Four sites, six service lines: revenue vs target, no-shows by booking lead time, payer mix and a location scorecard.
Open the demo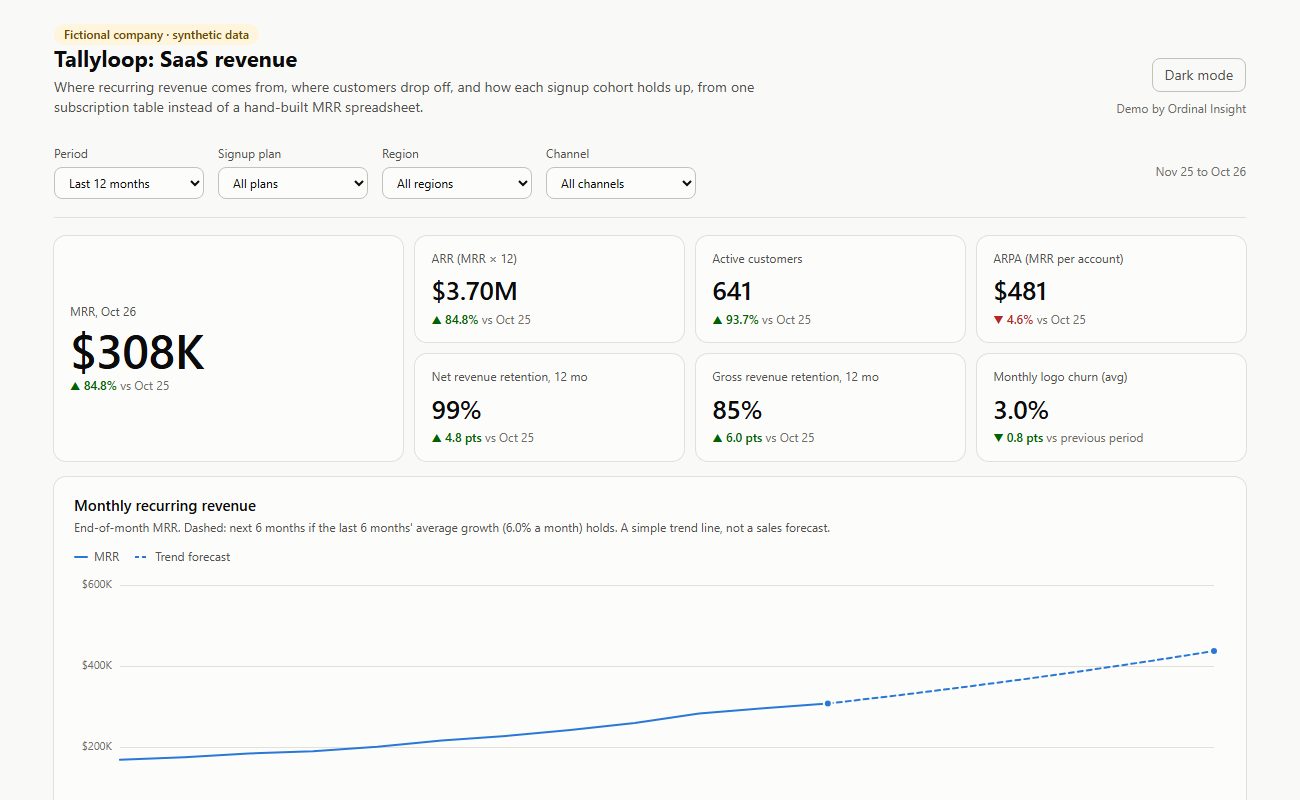
SaaS revenue
MRR and ARR, new, expansion and churned revenue, retention by cohort, and a simple forecast.
Open the demoHow it works
Clear scope up front, no surprises.
- 20-minute callHow you report today, what you need, and what data you have.
- Written scopeDeliverables, exclusions, price and timeline, agreed before work starts.
- Build and validateTotals reconciled to your source data before you see anything.
- HandoverWalkthrough and documentation, plus optional monthly support.
Your data stays yours
We use the minimum data needed, work inside your systems where possible, sign confidentiality terms before receiving anything, and never use one client's data for another. Patient-identifiable data is not needed for most reporting projects; where it is, contracts and safeguards come first.
Tell us how you report today
A 20-minute call to see whether a small, clearly scoped improvement would help.